Cloud monitoring service
The data sent to cloud server from SESMAE series can be managed and seen by your PC or smartphone connected to internet.
SESAME-WEB
WEB analysis software for multi device
Field data in your hand anytime, anywhere.
Below browsers are available: Internet Internet Explorer 10/11, Google Chrome, Safari.
Feature of SESAME-WEB page
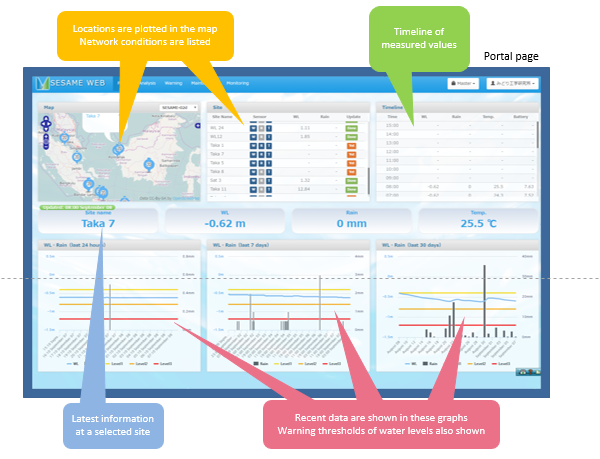
【Portal】
Measuring points are displayed in map and list. Click to choose the point.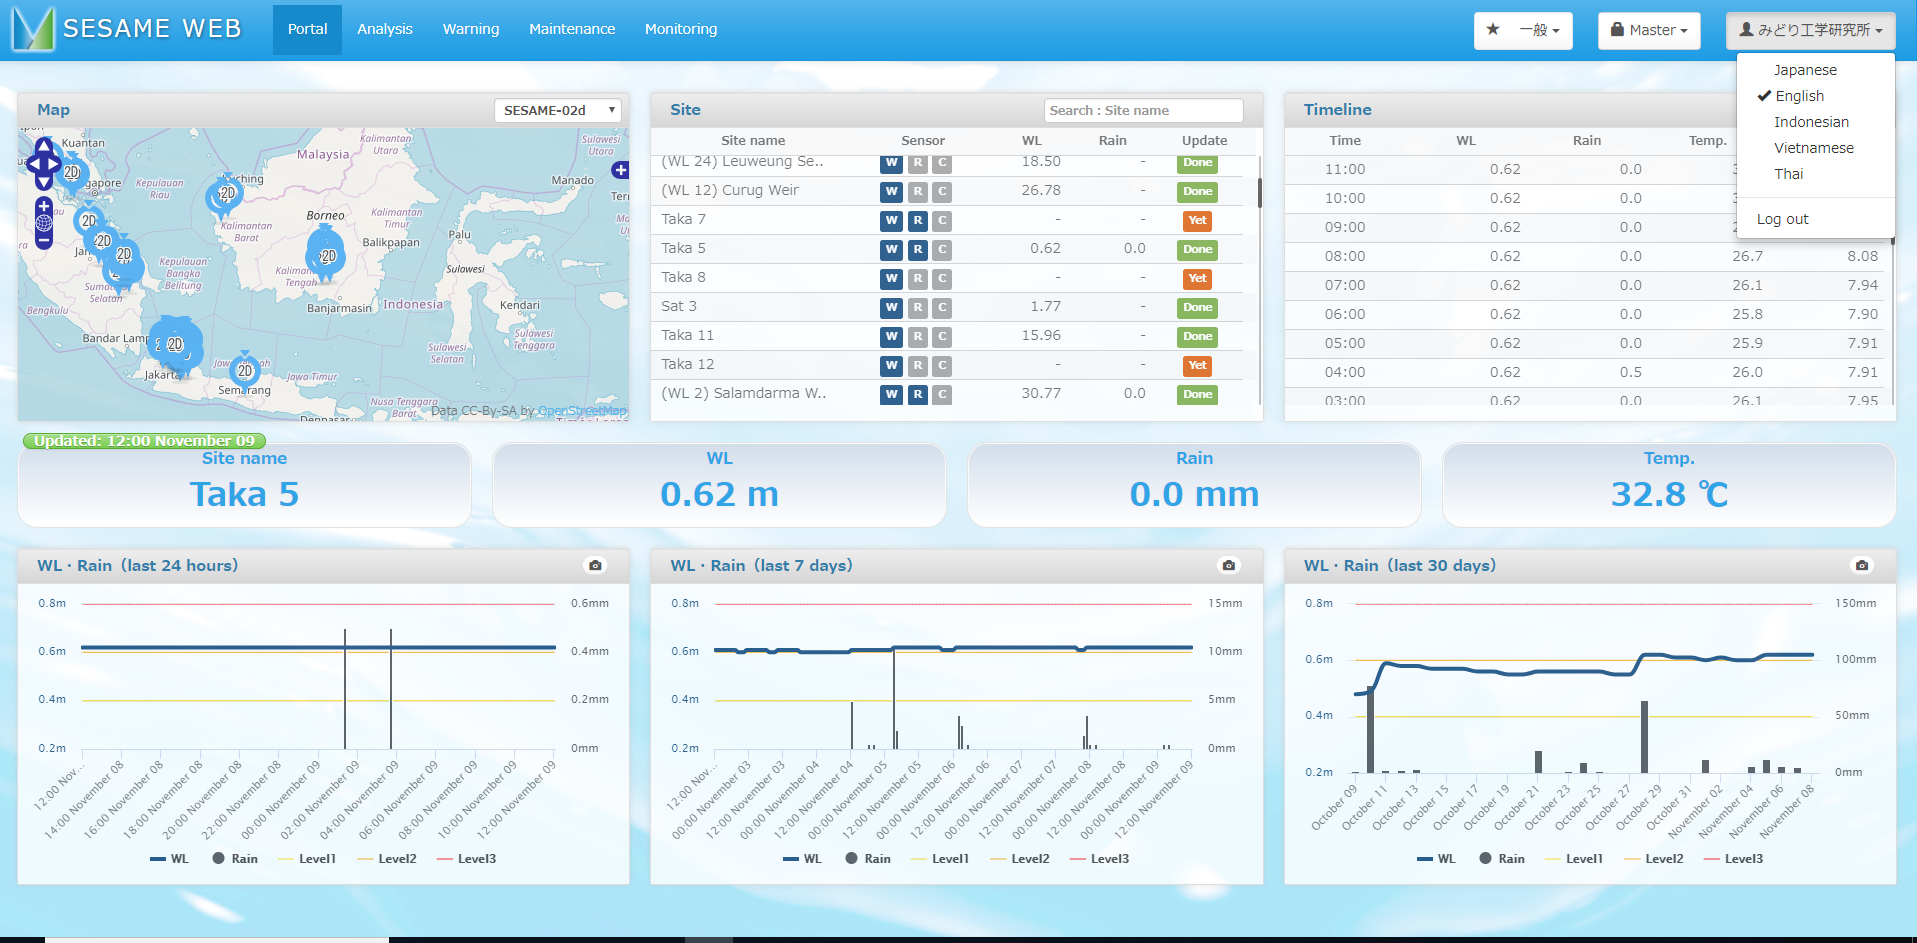
The data last 24 hours is displayed in timelines and graphs.
Data of water level and rainfall late 24 hours, 7 days, and 30 days, are displayed in the graph with alert level.
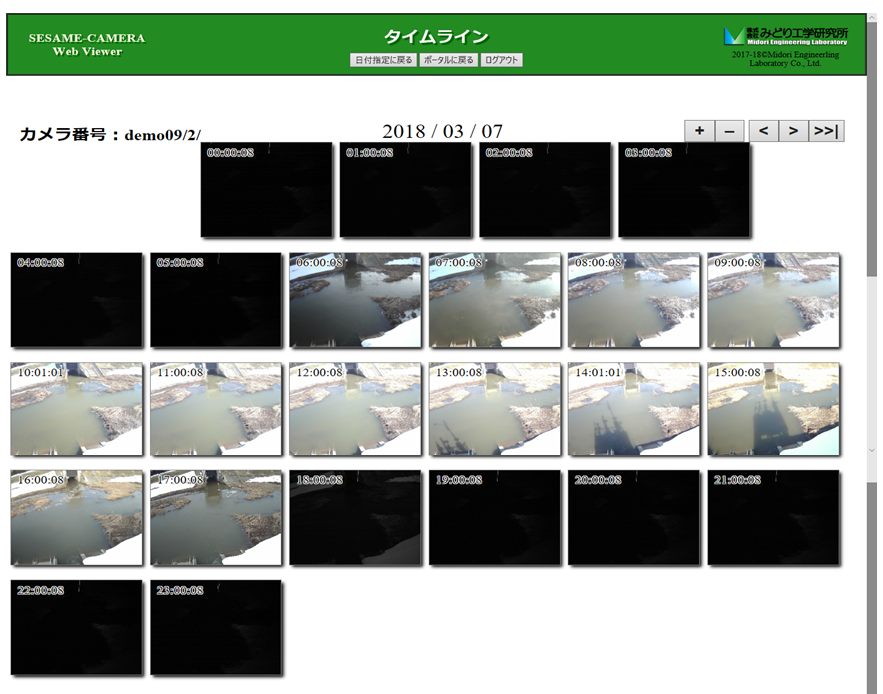
【Picture display】
This function is available only when you use SESAME-CAMERA.
By clicking the a point of graph, you can see the picture of the point taken at the date and time.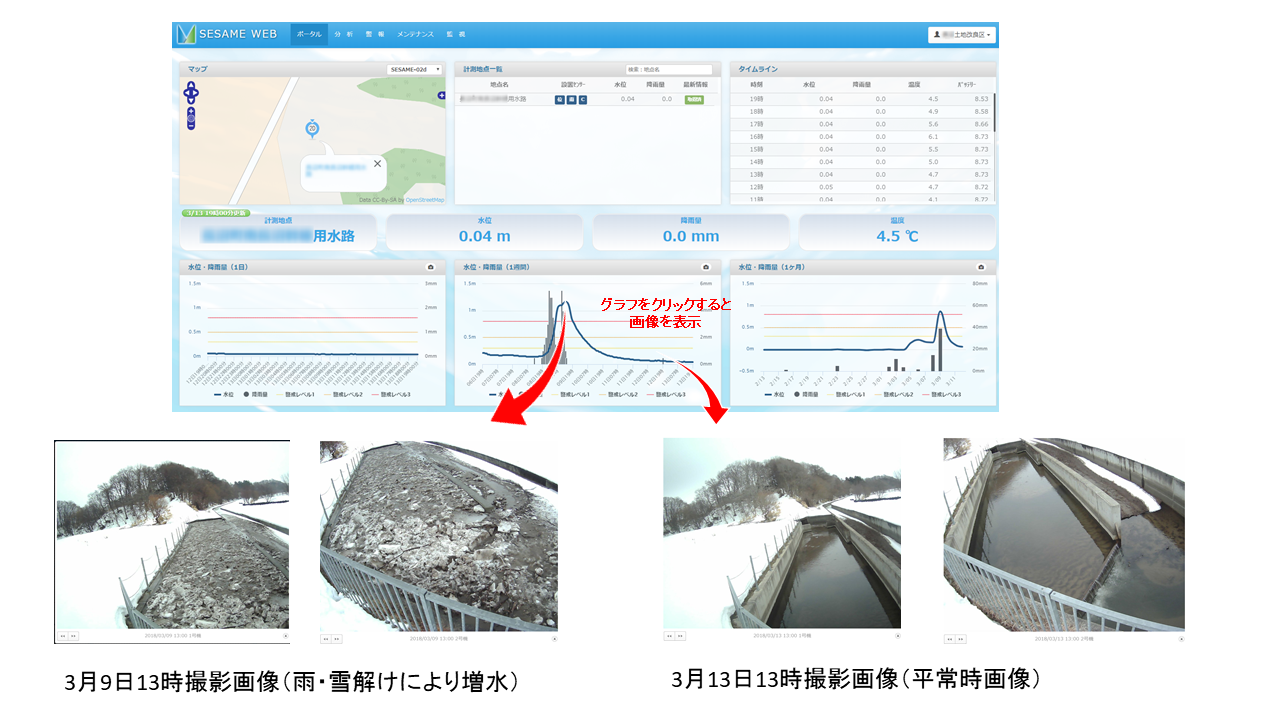
The example is comparison of the picture of normal and swollen river. You can confirm easily that the water level is increasing because of snow melting, not the breakdown of the device or something. Thus checking picture helps you to assume the situation from the value. (If you want see sample, click here.)
【Analysis】
By selecting measuring points, analysis term, time intervals, and measuring items, it enables you to analysis with high flexibility.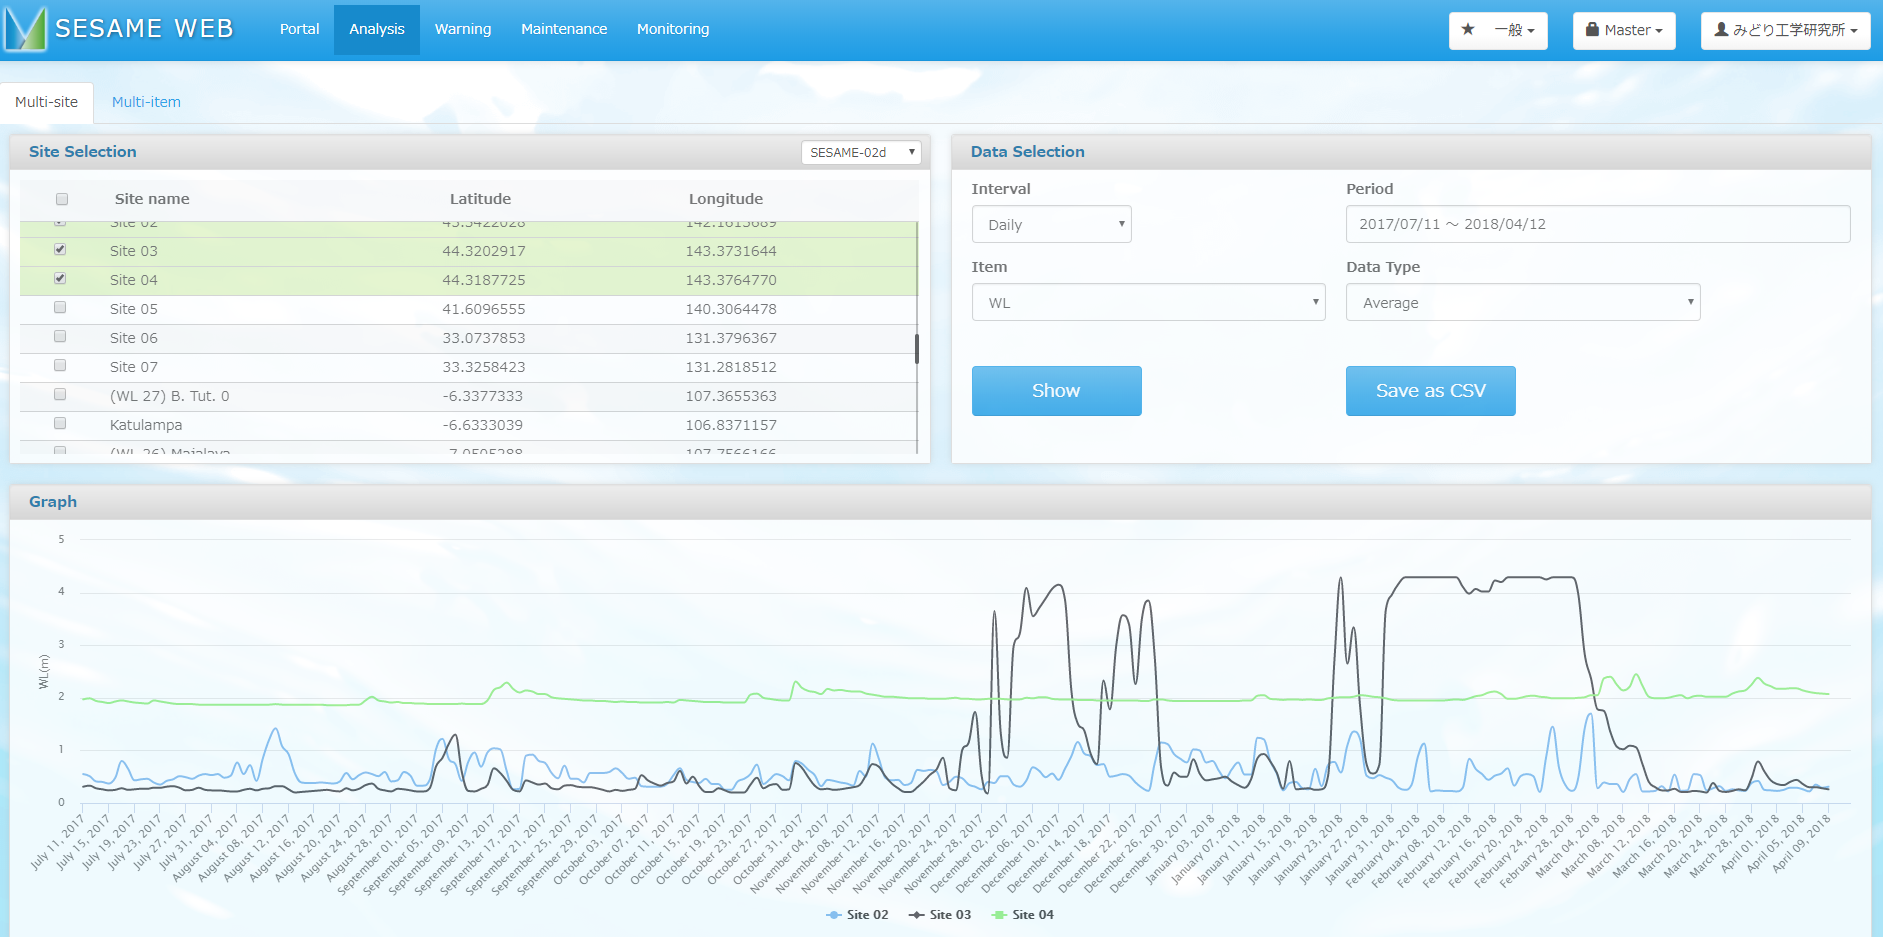
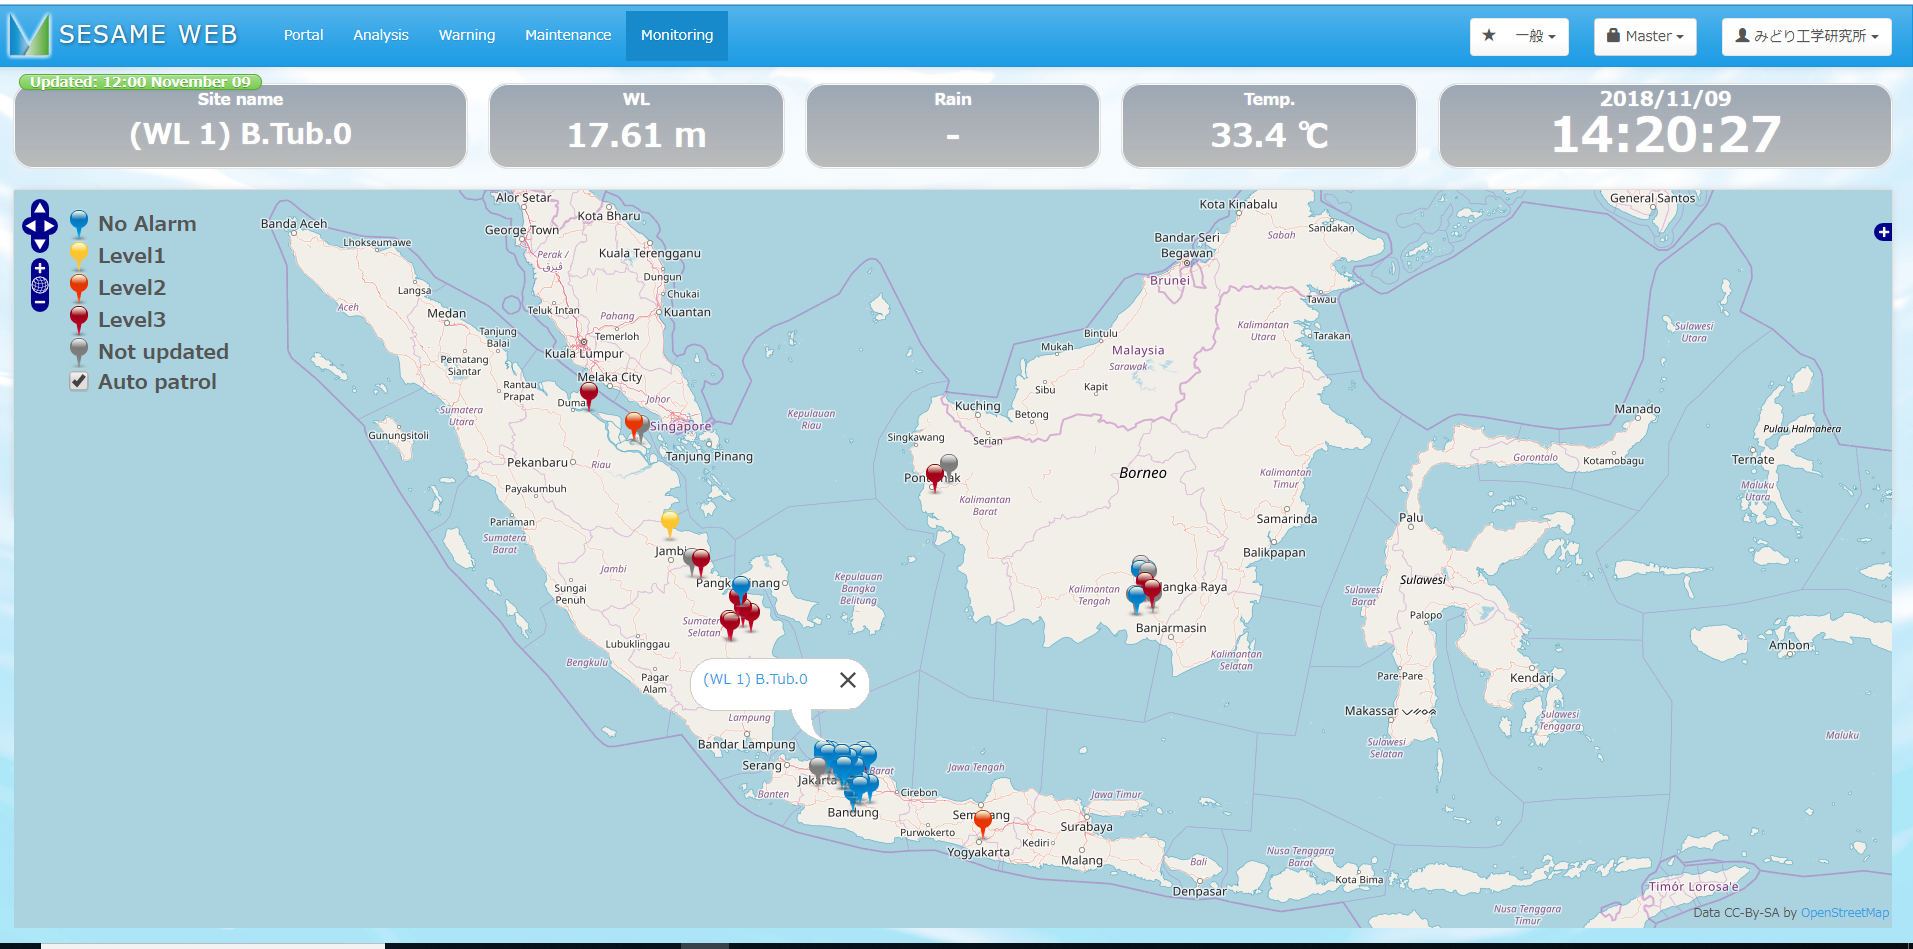
【Monitoring】
Automatic monitoring of the area you specified. It helps to disaster prevention and so on.